Bitcoin Profit Taking at $106K the First Stop Before New All-Time BTC Price Highs
Bitcoin recently faced a bearish breakout from an ascending channel, hitting an intraday high of $105,800 before dropping to $101,400. As traders prepare for upcoming U.S. CPI data, profit-taking risks loom around $106,000, with possible support near $100,000. A higher CPI could apply further bearish pressure, while lower numbers may revive bullish sentiment.
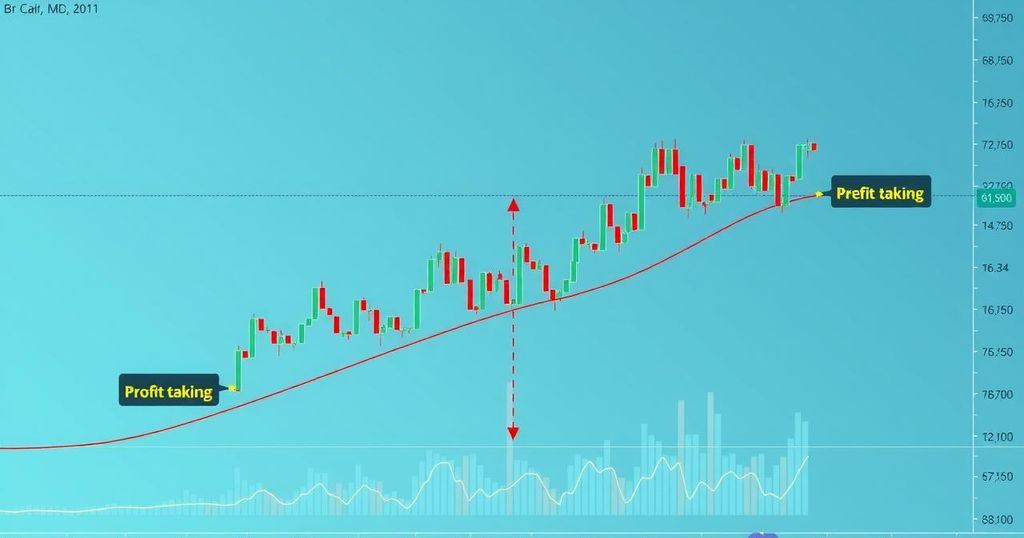
Bitcoin dipped following a bearish breakout from its rising channel, raising eyebrows among traders. After peaking at $105,800 on May 12, it quickly fell to $101,400 during the New York trading hours. This volatility is stirring discussions about potential profit-taking near the $106,000 mark, as analysts highlight risks tied to diminishing bullish momentum in the market.
Data from Alphractal indicates that Bitcoin is approaching what they call the “Alpha Price” zone, a region where long-term holders might consider cashing in on their investments. CEO Joao Wedson pointed out that this could heighten the chances of profit-taking as BTC hurdles toward the critical resistance level of $106,000. Essentially, we’re in a make-or-break moment.
As if that weren’t enough, there’s a looming risk of a “long” squeeze. About $3.4 billion worth of leveraged long positions could be wiped if Bitcoin tumbles to the $100,000 range. This level might attract further selling pressure, eventually dragging the price down even more. Traders are, understandably, uneasy.
Adding a layer of complexity to the Bitcoin situation is the upcoming U.S. Consumer Price Index (CPI) report due on May 13. The CPI, a barometer to measure inflation, currently has folks on edge. March’s CPI showed 2.4%, a minor retreat from February’s 2.8%, while many expect April’s numbers to stick around 2.4% as well. If inflation stays the course, it could encourage the Fed to delay rate hikes, which may end up benefiting riskier investments, Bitcoin included.
However, it’s a double-edged sword; a CPI report that comes in higher than anticipated might reignite fears around inflation, leaving Bitcoin vulnerable. If post-report pressures continue, traders should keep a keen eye on the fair value gap (FVG) between $100,500 and $99,700 on the four-hour chart. This zone could draw in buyers looking for a bargain.
And yet, that’s not the only FVG noted; there’s another significant gap between $98,680 and $97,363, indicating a possible 8% correction from Bitcoin’s recent highs. With all these factors intertwining, traders are perched at the edge of their seats.
As always, this piece does not offer investment advice. Navigating the tumultuous waters of trading always carries risk, and thorough research should be your compass before venturing into the market.
Bitcoin is facing a turbulent moment, with recent bearish trends and key economic data on the horizon. With potential profit-taking at the $106,000 mark and looming CPI data, traders are running the risk of a significant market shift. The outcome of the CPI release could either bolster BTC’s rise or further drag it down. All this uncertainty emphasizes the importance of cautious trading as market elements collide.
Original Source: cointelegraph.com

Post Comment